SMAT-CE: Software of Model Attainment Test - Community Edition
空气质量达标评估工具
Introduction 系统简介
SMAT-CE is the next generation of Modeled Attainment Test Software (MATS). SMAT-CE implements modeled attainment tests for particulate matter (PM2.5) and ozone (O3), and performs the uniform rate of progress analysis for regional haze (visibility). The results from SMAT-CE can be used to provide scientific support for air pollution control strategies and decision making.
Assessment principle 评估方法
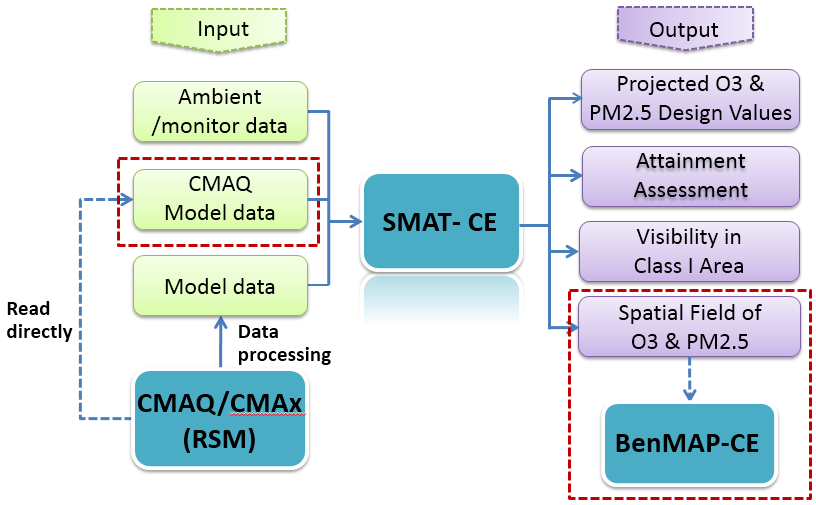
SMAT-CE performs the U.S. EPA modeled attainment test to estimate whether an emissions reduction strategy will produce future ambient air pollution concentrations that meet air quality standards. The attainment test methodology projects future year design values at monitoring sites by multiplying base year design values with modeled relative response factors (RRFs) calculated from grid cells surrounding each site. The RRF is the ratio of the future year modeled concentration predicted near a monitor (averaged over multiple days, e.g. quarterly average) to the base year modeled concentration predicted near the monitor (averaged over the same days).
SMAT-CE uses model and monitor data as input. The model data are generated by either an air quality model (CMAQ or CAMx) or from a response surface model (RSM). SMAT-CE uses the U.S. EPA attainment test methodology to estimates concentrations at monitoring sites (i.e. future year design values) and fused spatial fields of projected concentrations in the study area (i.e. unmonitored area analysis).
Functional Design 功能框架
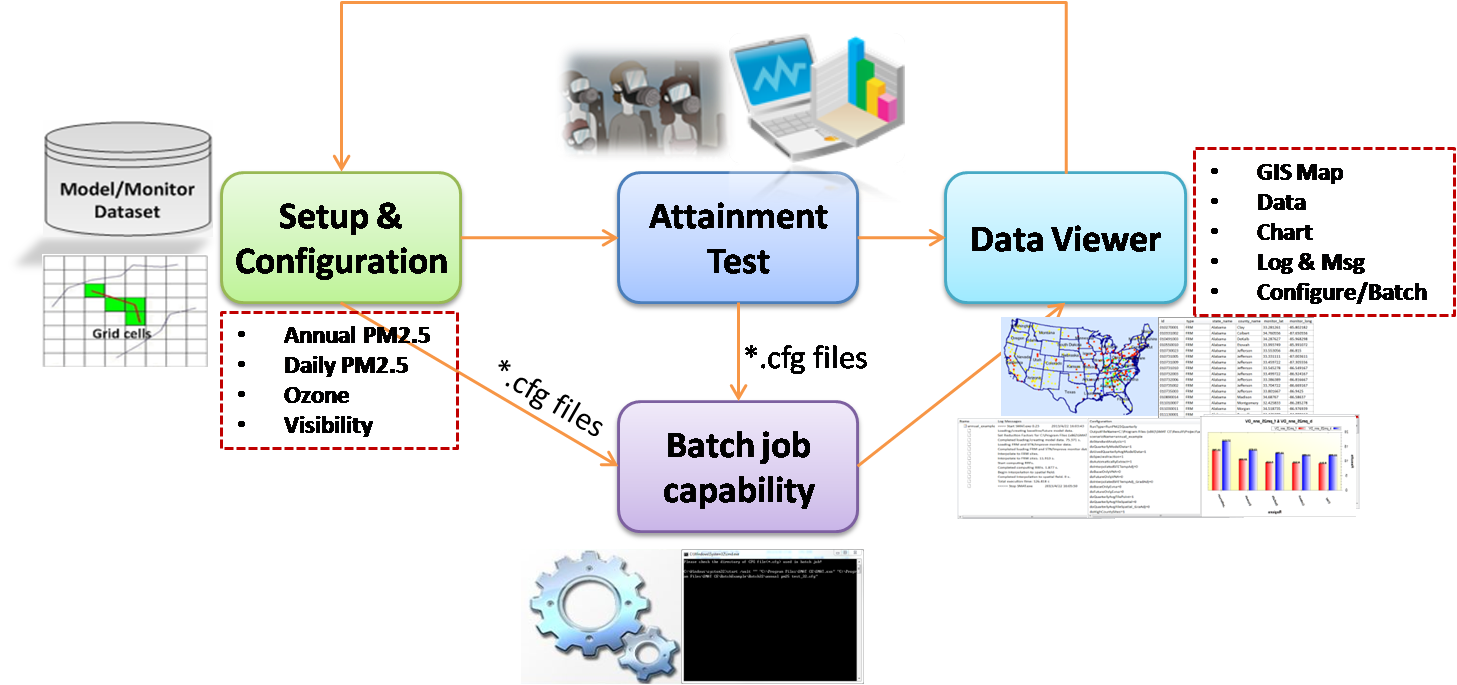
SMAT-CE consists of three modules:
The
Configuration Module
provides an option for using a configuration file for batch processing of multiple emissions/air quality scenarios.
The
Attainment Test/Analysis Module
projects the PM2.5 and O3 design values for both monitor site and fused spatial field analyses. This module calculates the base year and future visibility levels for the 20% best and worst days at each Class I area in the study domain.
The
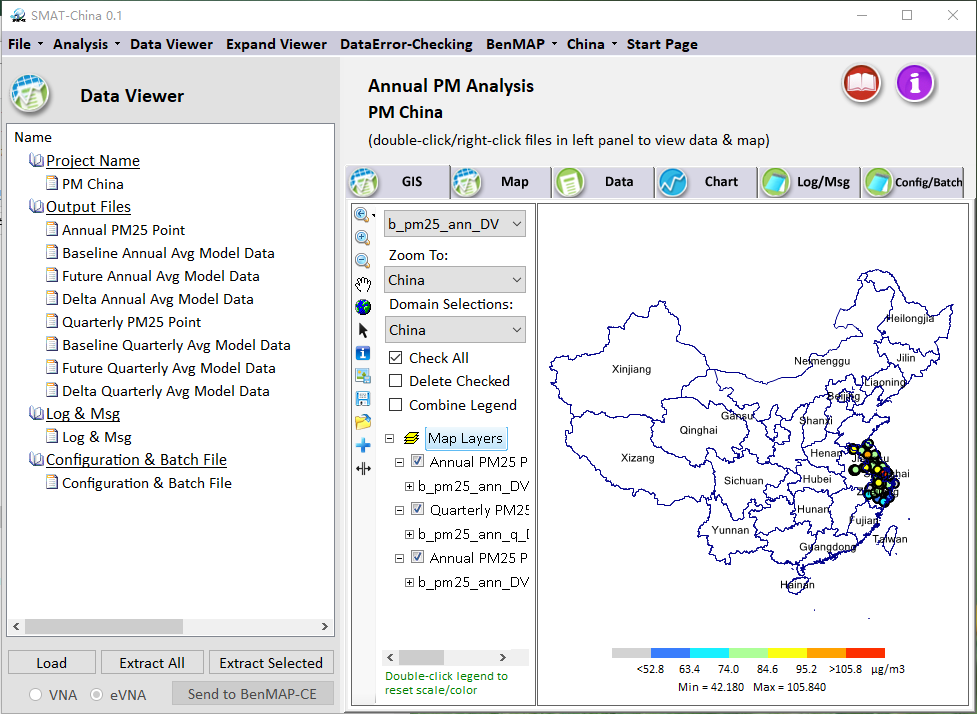
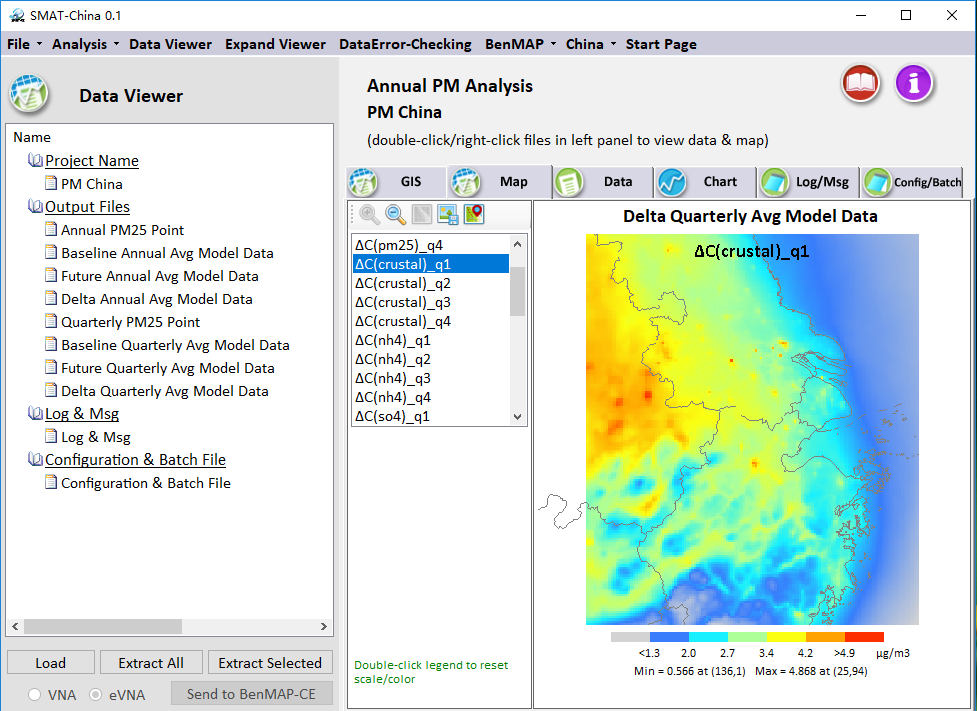
Data Viewer Module
provides mapping and GIS functions to visualize the base and future year concentrations. This module also includes charting capabilities to aid in interpreting the attainment tests results.
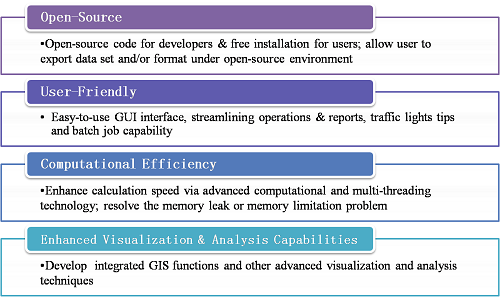
Performance Enhancement 系统特点
User Interface 操作界面
Start Page
Point estiamtes in GIS MAP
Spatial field estimates in MAP